Bollinger Bands: A Fun Roller Coaster Ride in Stock Trading
Dive into the thrilling world of stock trading with Bollinger Bands. Understand how these 'roller coaster tracks' guide traders through potential highs and lows of a stock's price, empowering you to make more informed decisions.

Introduction
Ever been on a roller coaster? That thrilling ride where you zip up and down between the tracks? The stock market can feel a lot like that. Technical indicators, like Bollinger Bands, are our tracks on this exciting ride, helping us navigate the ups and downs.
What are Bollinger Bands?
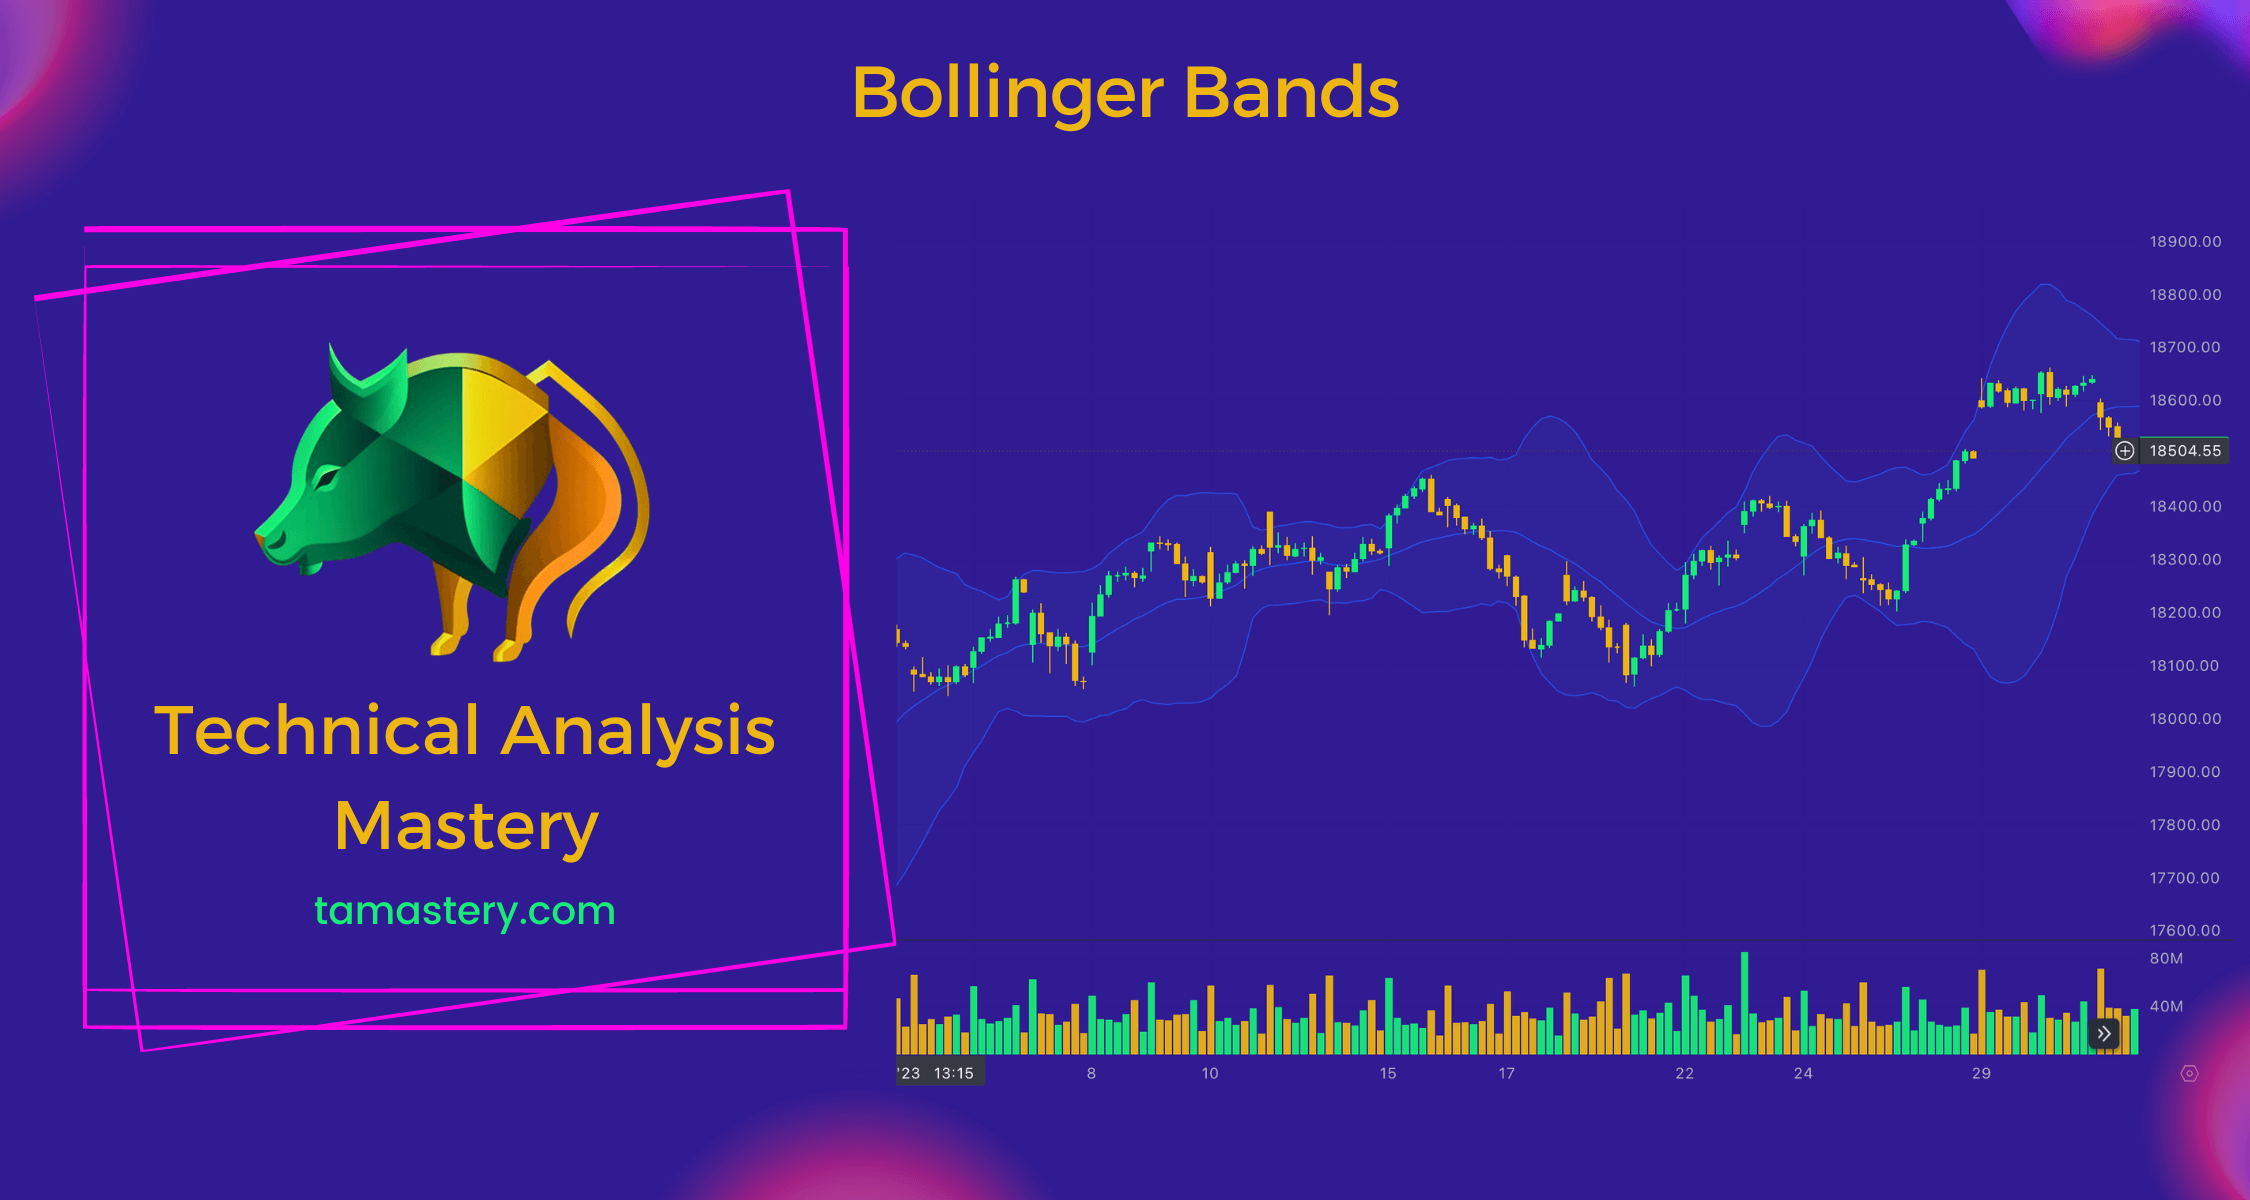
Imagine three lines on a graph. The middle line is like the center of a road, with two outer lines serving as the road edges. These lines are the Bollinger Bands. They give us a pretty good idea of how a stock's price might wobble - sort of like watching a car sway within the lines on a bumpy road.
How Bollinger Bands Work
The middle line of the Bollinger Bands, like the center line on a road, represents a kind of moving average of the stock's price. The upper and lower 'bands' are calculated based on how dramatically the stock's price changes - like measuring how high and low a bouncing ball might go.
So, if a stock's price touches the upper band, it might bounce back down. Conversely, if it hits the lower band, it might bounce back up.
Why are Bollinger Bands Helpful in Trading?
Bollinger Bands act like a roller coaster's tracks. They provide an idea of the highest and lowest points of the ride. When we see these highs and lows, we can make better decisions, like whether we're ready for this roller coaster or if we'd rather wait for the next ride.
How to Use Bollinger Bands in Trading
If a stock's price hits the upper band, it could be an indication to sell, much like deciding to bounce the ball when it's reached the highest point. If the price hits the lower band, it might be time to buy, like catching the ball at its lowest bounce
Conclusion
Navigating the stock market can be a thrilling ride. Bollinger Bands help us see the potential ups and downs, making the ride a bit less surprising. However, remember that while these tools can offer helpful clues, they're not fortune-telling devices. Keep exploring and learning about other indicators to enhance your stock trading journey.
Glossary
Bollinger Bands: A set of three lines on a chart that indicate the potential highs and lows of a stock's price based on its previous performance.
Moving Average: An average of a stock's price over a specific period, often used to identify price trends.
