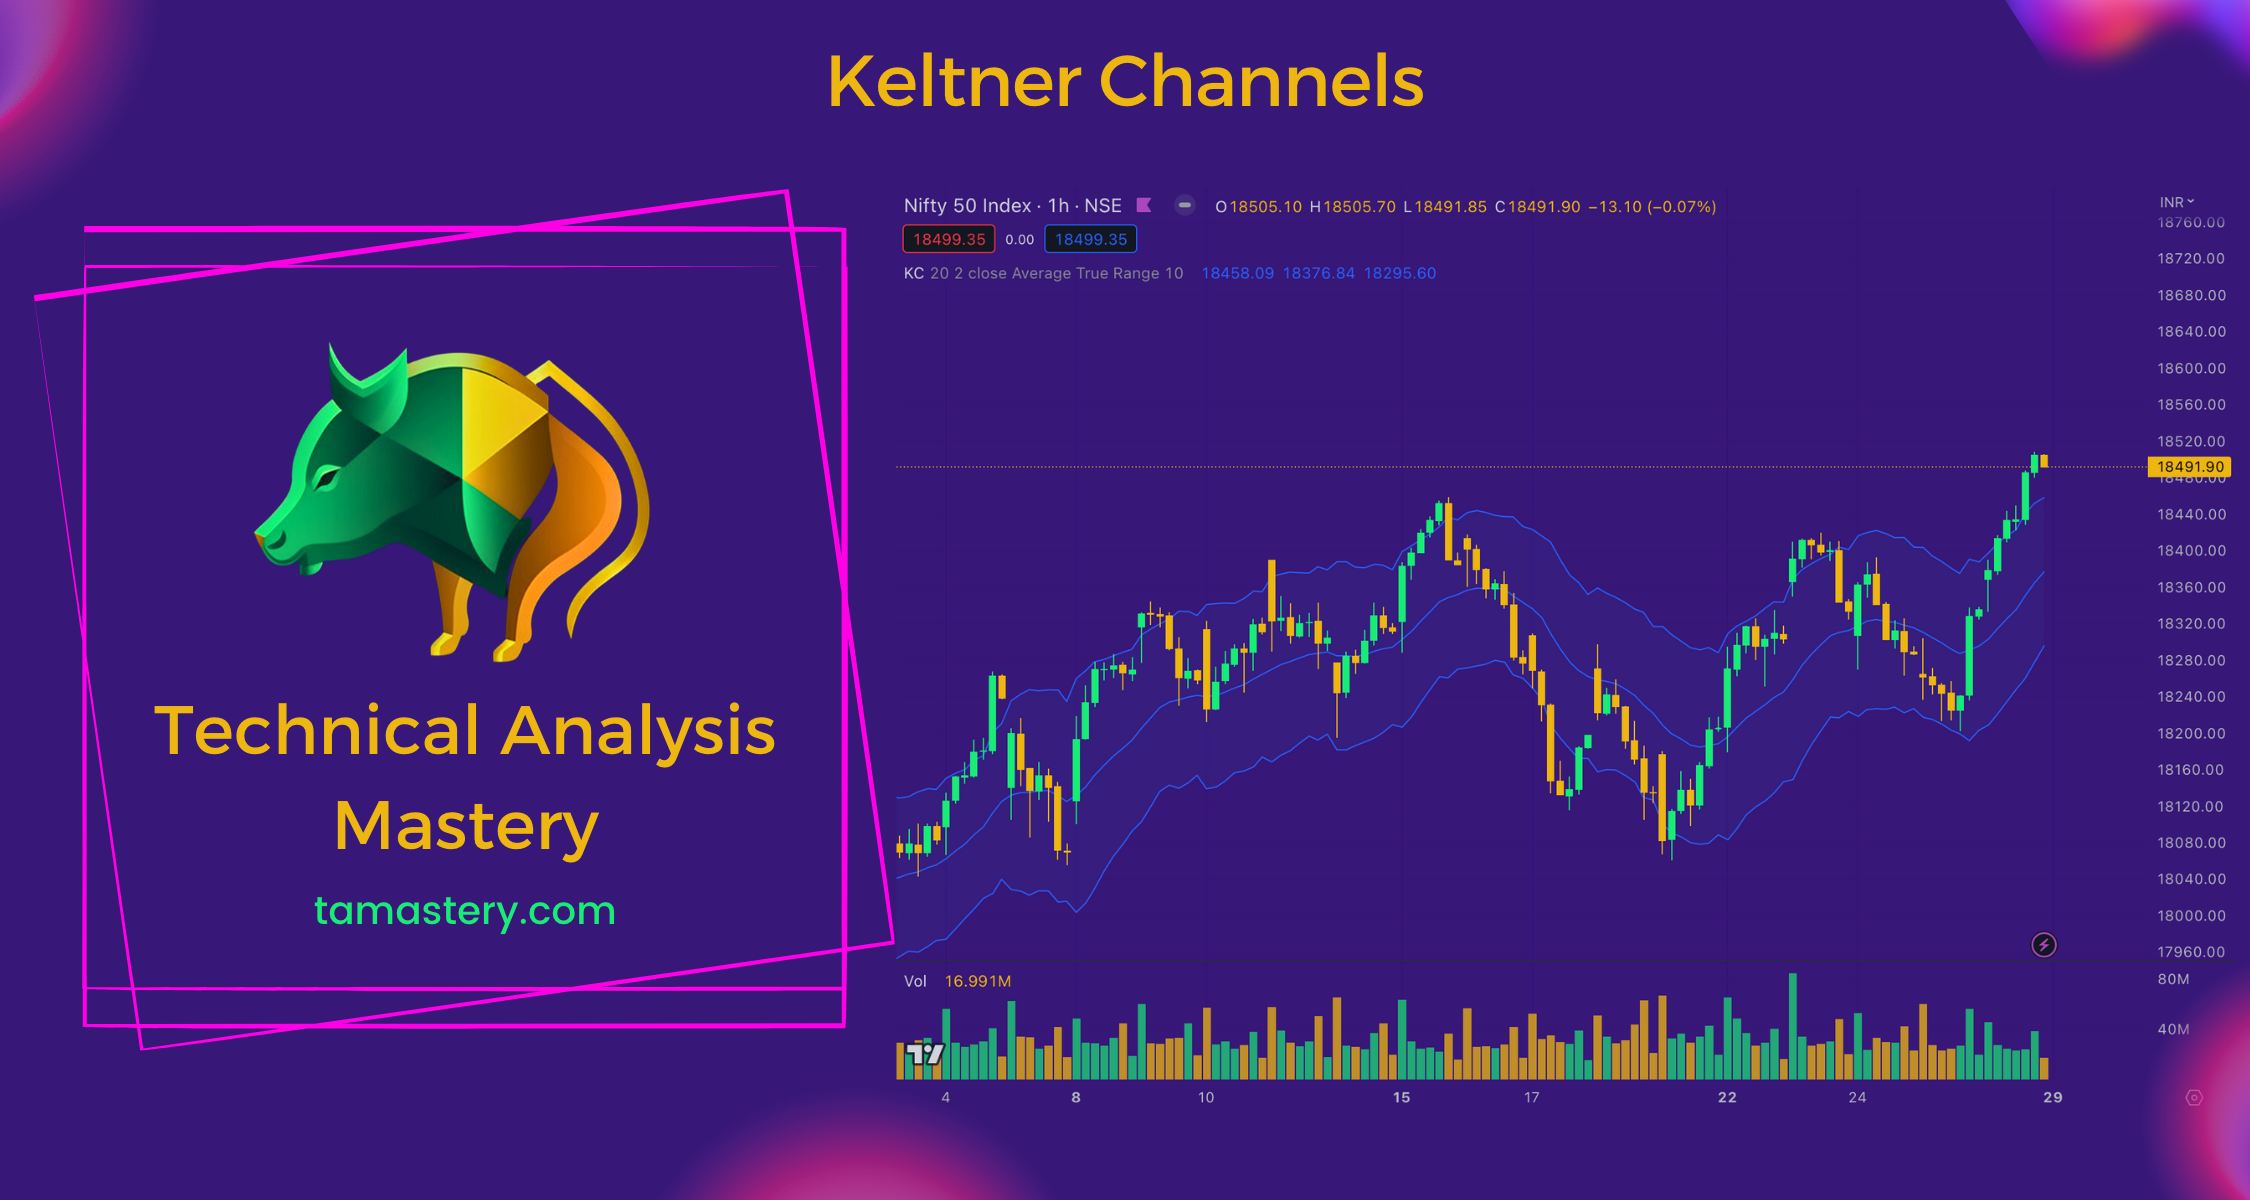
Keltner Channels: The Race Track of Stock Trading
Explore Keltner Channels, the race track of stock trading. This tool charts the typical path of a stock's price, helping traders predict potential shifts. Just like racetrack guardrails, Keltner Channels signal when it may be time to buy or sell. Enhance your trading strategy with this dynamic tool.

Introduction
Welcome back to the exhilarating world of stock trading, a place filled with intricate charts, indices, and terms that help us navigate through the waves of the market. Among these tools, technical indicators play a vital role, just like a roadmap guiding travelers. One such tool is the Keltner Channels, the racetrack of stock trading, designed to give traders an insight into the usual path a stock's price tends to follow.
What are Keltner Channels?
Just like how a racetrack outlines the path for race cars, Keltner Channels act as boundaries for a stock's price on a chart. They create a 'track' that encapsulates the common price range, assisting traders in predicting the price's path. This invaluable tool is named after its developer, Chester W. Keltner, and is often used in charting software.
How Keltner Channels Work
Keltner Channels work like a smart racetrack designer who lays out the course based on the average speed and movements of the race cars. In our trading world, these channels are calculated using the average price and volatility of a stock, which means how much the price jumps around. The resulting lines form a band around the price, offering a visual representation of the typical price range.
Why are Keltner Channels Helpful in Trading?
Keltner Channels are like racetrack guardrails that alert drivers when they need to turn or slow down. For traders, these channels help predict when a stock's price might be about to shift direction. If a price veers towards the outer boundaries of the Keltner Channels, it's like a car pushing towards the outer edge of the racetrack, signaling a possible turn or change in speed ahead.
How to Use Keltner Channels in Trading
Interpreting Keltner Channels can help inform your buy and sell decisions. If the stock's price crosses above the upper channel, it might be a signal to sell. It's like seeing a race car surging ahead of the pack - a cue that it might be time to slow down. Conversely, if the price drops below the lower channel, it might be a good time to buy, similar to how a lagging car might be gearing up to speed up and catch the race.
Conclusion
To sum it up, Keltner Channels in stock trading are much like a racetrack in a car race, providing guidance and offering signals about potential changes in direction. However, remember that while these tools are immensely helpful, they can't predict the future with absolute certainty. Keep exploring other technical indicators to strengthen your understanding and broaden your toolkit.
Glossary
Keltner Channels: A set of bands placed above and below a moving average of a stock's price, indicating the price's typical range based on its volatility.
Volatility: The rate at which the price of a stock increases or decreases for a set of returns. Volatility is often measured as a standard deviation.
