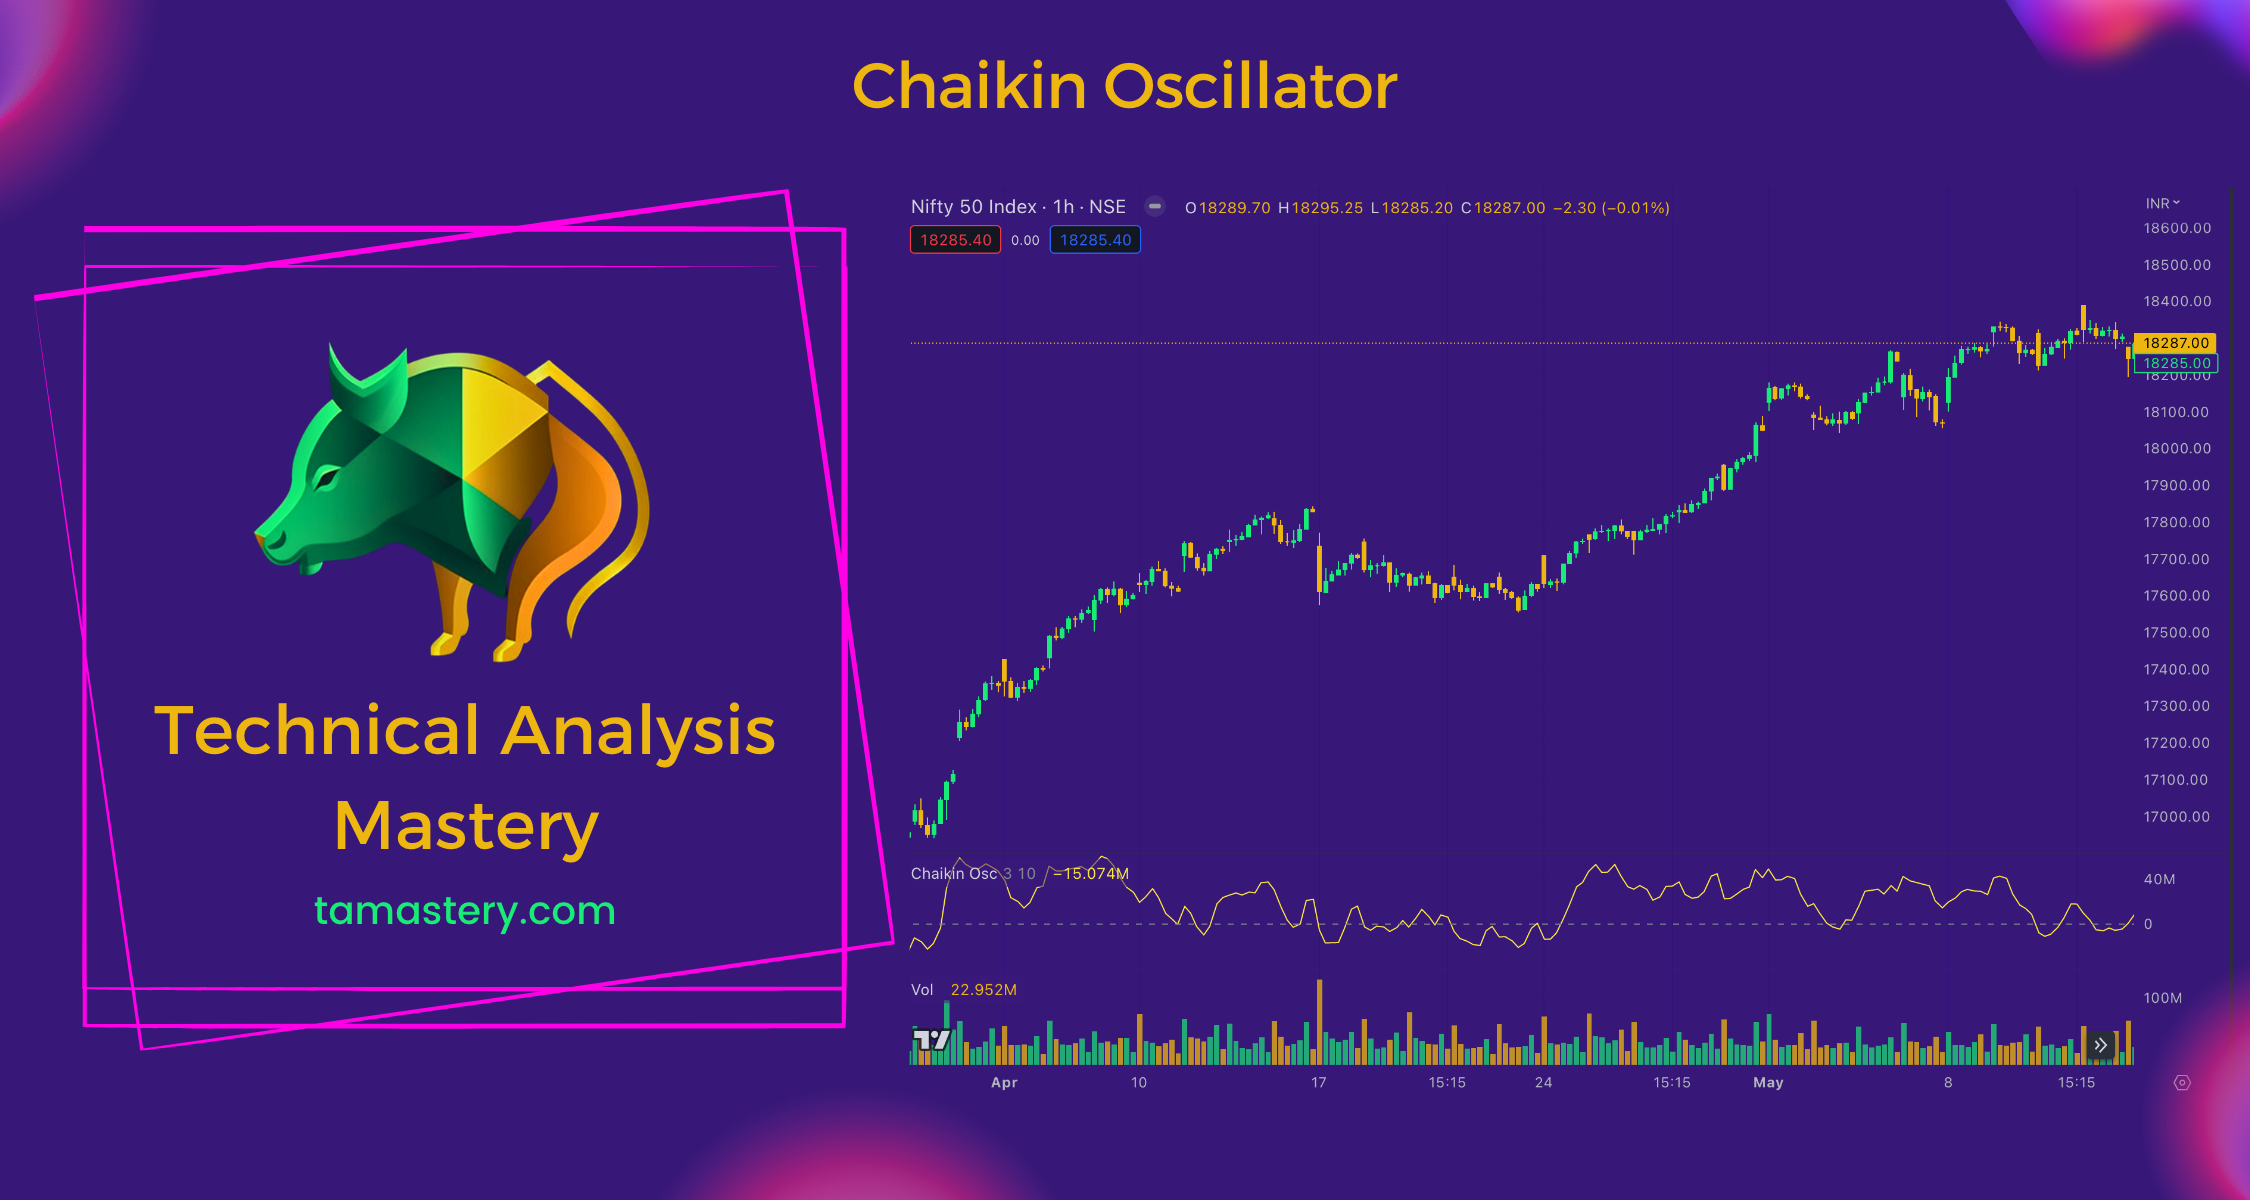
Chaikin Oscillator: The Seesaw of Stock Trading
Navigate the stock market playground with the Chaikin Oscillator - a tool that acts like a seesaw, illustrating the flow of money in and out of stocks. Understanding this can help anticipate potential price changes, guiding traders to make informed decisions.

Introduction
Think back to your childhood and the countless hours spent at the park playing on the seesaw. Now, let's imagine the stock market as a giant playground, filled with various seesaws representing different stocks. The traders are like the children who decide to buy (hop on) or sell (hop off) shares of a company. This buying and selling create the fluctuations we see in stock prices. Technical indicators act as our eyes and ears on this playground. One such handy tool is the Chaikin Oscillator. It gives us a sense of whether more traders are buying or selling.
What is the Chaikin Oscillator?
The Chaikin Oscillator is a tool that shows us the flow of money into and out of a stock, much like how a seesaw would show if more kids are climbing on (buying) or jumping off (selling). This flow of money, known as "money flow," refers to the total value of trades (price times volume) flowing into or out of a security. The Chaikin Oscillator was created by Marc Chaikin, an expert in stock market analysis. His creation helps us understand whether the stock is likely to rise (more buying) or fall (more selling).
How the Chaikin Oscillator Works
The Chaikin Oscillator operates by taking a quick peek at who's been buying and selling in the short-term (over the last few days) and comparing it to the longer-term trend (over the last several days).
In more technical terms, the Chaikin Oscillator is calculated by subtracting the 3-day exponential moving average (EMA) of the Accumulation/Distribution Line from the 10-day EMA of the same line. Here, the Accumulation/Distribution Line represents the lineup of traders buying or selling, while the EMAs represent the average number of shares bought or sold over specific periods. The 3-day EMA represents the recent trading activity, while the 10-day EMA represents the longer-term trend.
The Chaikin Oscillator helps traders anticipate potential changes in stock prices. It's not infallible, though, as sudden news or events can affect a stock's price. Therefore, while the Chaikin Oscillator is a valuable tool, it should be used alongside other indicators, like Moving Average Convergence Divergence (MACD) or Relative Strength Index (RSI), and market information to make well-informed trading decisions.
How to Use the Chaikin Oscillator in Trading
When the Chaikin Oscillator starts to climb, it may suggest that it's a good time to buy the stock, expecting the price to rise as more money flows in. On the other hand, if the Chaikin Oscillator begins to drop, it may be a sign that it's a good time to sell, anticipating the stock's price to decrease as money starts to flow out.
Conclusion
The Chaikin Oscillator is a useful gauge to see how money is flowing in and out of a stock. It's a tool that helps traders anticipate potential price changes and make informed decisions. However, it doesn't provide a sure-fire prediction, so always remember to use other technical indicators alongside it and stay updated with market news. Keep learning and have fun trading in the vast playground of the stock market!
Glossary
Chaikin Oscillator: A technical analysis tool that measures the momentum of the Accumulation/Distribution Line using the formula [3-day EMA of the Accumulation/Distribution Line - 10-day EMA of the Accumulation/Distribution Line].
Money Flow: The total value of trades (price times volume) flowing into or out of a security.
