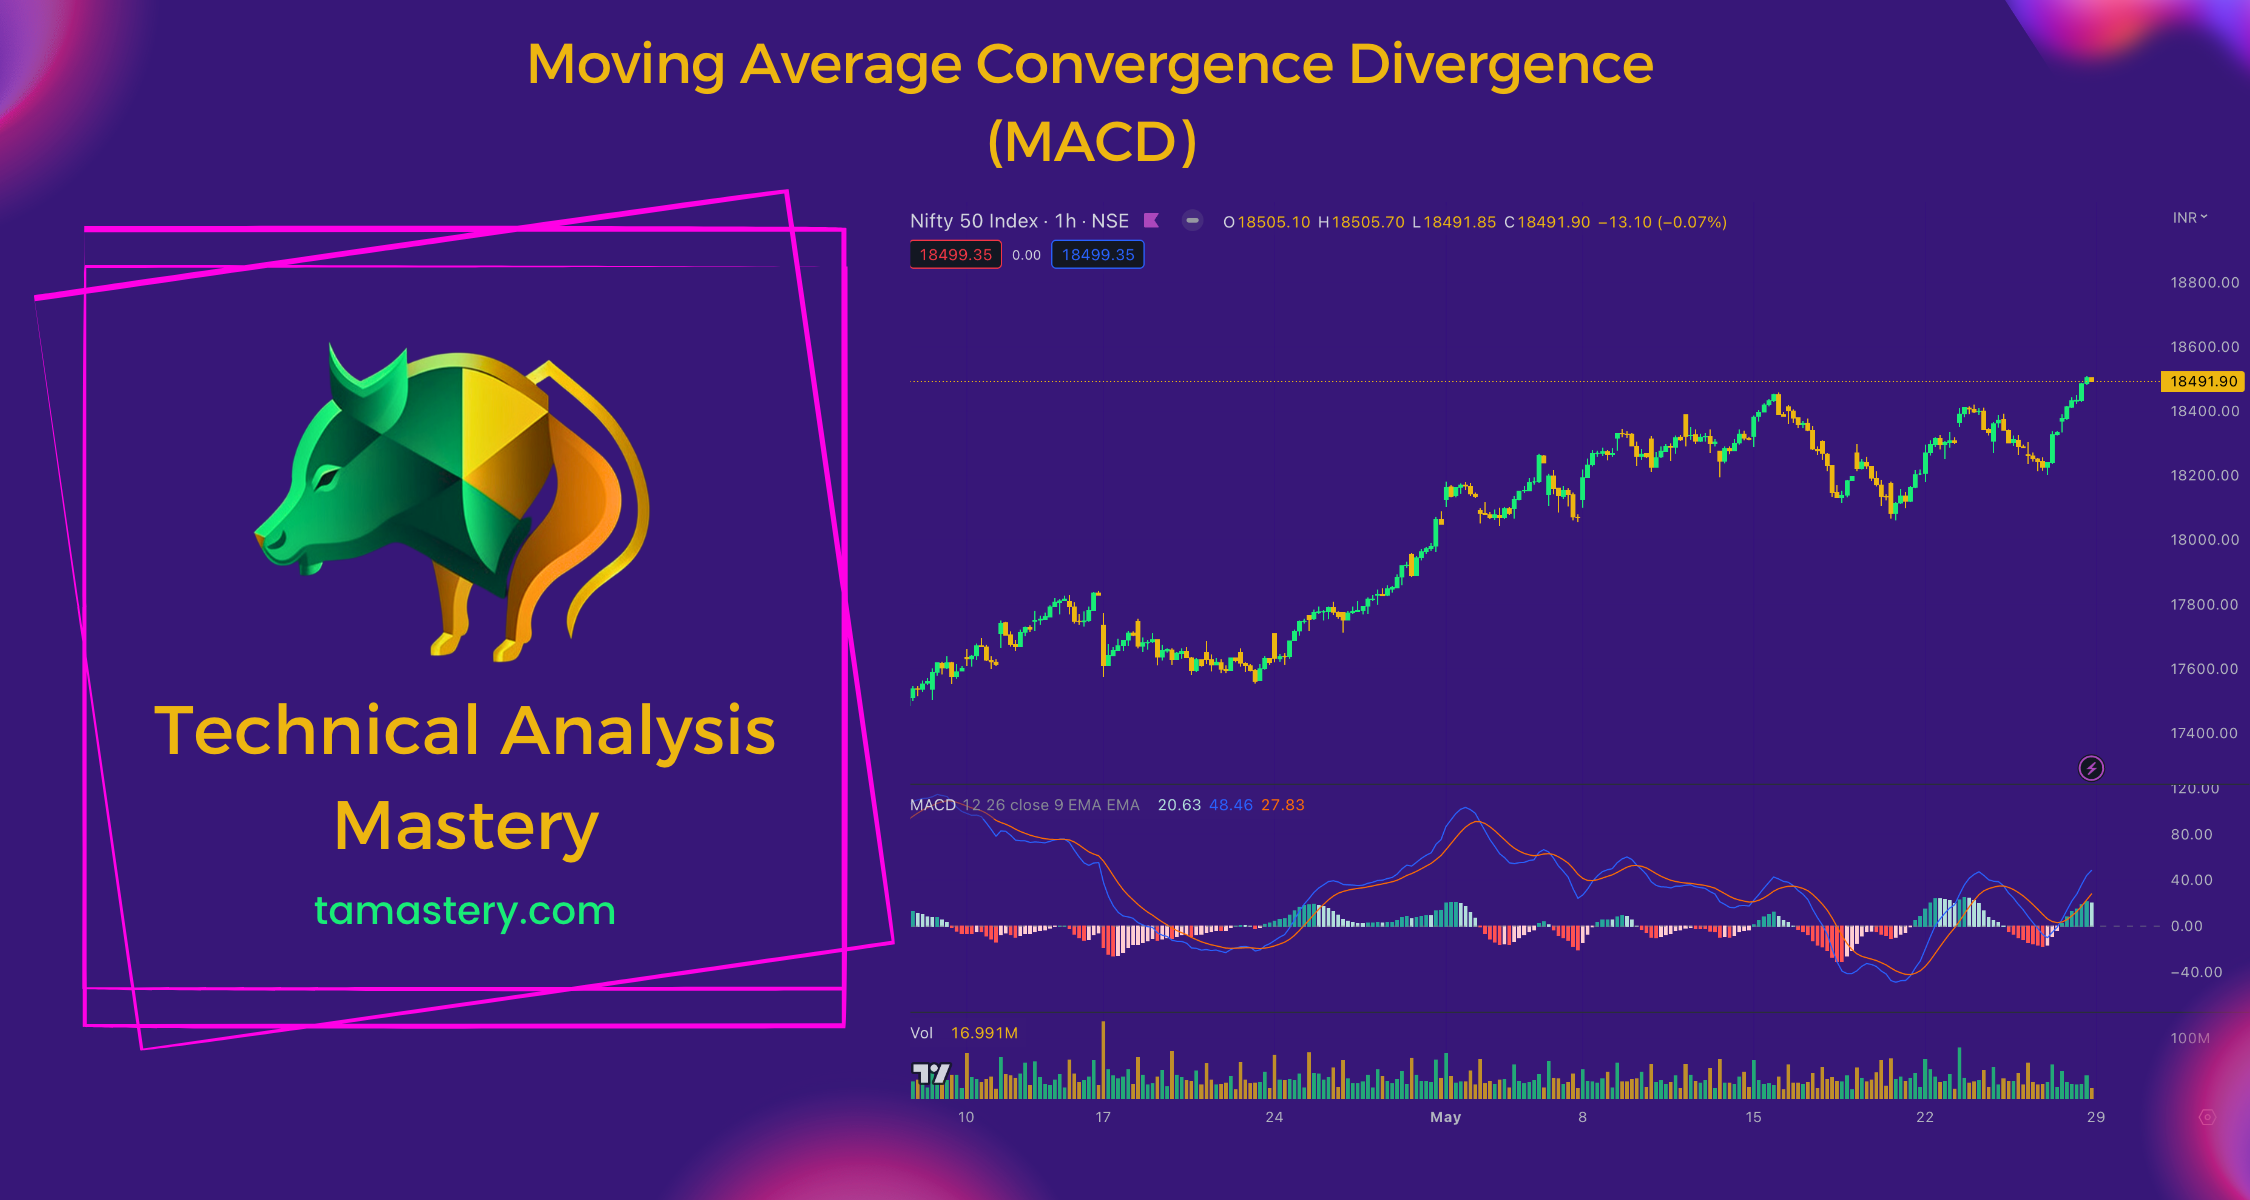
The MACD: Uncovering the Secret Signal of Stock Trading
Learn about the MACD, or Moving Average Convergence Divergence, a technical trading tool acting like a secret signal predicting possible stock price changes. This comprehensive guide simplifies the MACD concept, making it accessible for beginner traders.

Introduction
Hey there, young traders! Remember the stock market, that wild world where we buy and sell pieces of companies? We've got all sorts of gadgets and gizmos, called technical indicators, to help us make smart moves. One of them is the MACD, or Moving Average Convergence Divergence. Think of it as a secret signal, kind of like a detective's clue, that tells us when the stock's price might take a U-turn. Intriguing, right?
What is the Moving Average Convergence Divergence (MACD)?
In simple terms, the MACD is like a race between a rabbit (short-term average) and a turtle (long-term average) on a track. When the rabbit speeds past the turtle, it might signal that the stock's price is about to change direction.
How the MACD Works
Imagine a track with our rabbit and turtle—the rabbit is quick and represents the short-term average, while the turtle is slow and signifies the long-term average. If the rabbit speeds past the turtle, that's a positive MACD, and it might be a good time to buy the stock. If the turtle pulls ahead, that's a negative MACD, signaling it might be time to sell.
Why is the MACD Helpful in Trading?
Just like a weather vane shows us when the wind direction changes (and possibly the weather!), the MACD can help traders spot potential 'turning points' in a stock's price. It's a neat tool that can give you an edge when deciding when to buy or sell.
Understanding the MACD Line and the Signal Line
So, we've got two lines in this race. The MACD Line is our quick rabbit, and the Signal Line is like our steady turtle—it's an average of the MACD Line. When the rabbit (MACD Line) passes the turtle (Signal Line), it could be an important clue for traders.
How to Use the MACD in Trading
When the MACD Line (our speedy rabbit) crosses above the Signal Line (our steady turtle), it could be a good time to buy. If it crosses below, it might be time to sell. Just like in a race, when the faster runner overtakes the slower runner, it's a signal!
Conclusion
Think of the MACD as your secret signal to help you predict potential changes in a stock's price. While it's a powerful tool, remember, it's not a crystal ball that can see the future—it's more like a detective's clue. So keep learning about other technical indicators to become a smarter trader.
Glossary
Moving Average: This is an average of a stock's price over a certain period.
Trend: The general direction in which something is developing or
changing.MACD: Short for Moving Average Convergence Divergence, it's a trading indicator that shows when a stock's price might be about to change direction.
Signal Line: A slower moving average of the MACD Line, used to identify potential buy or sell signals.
