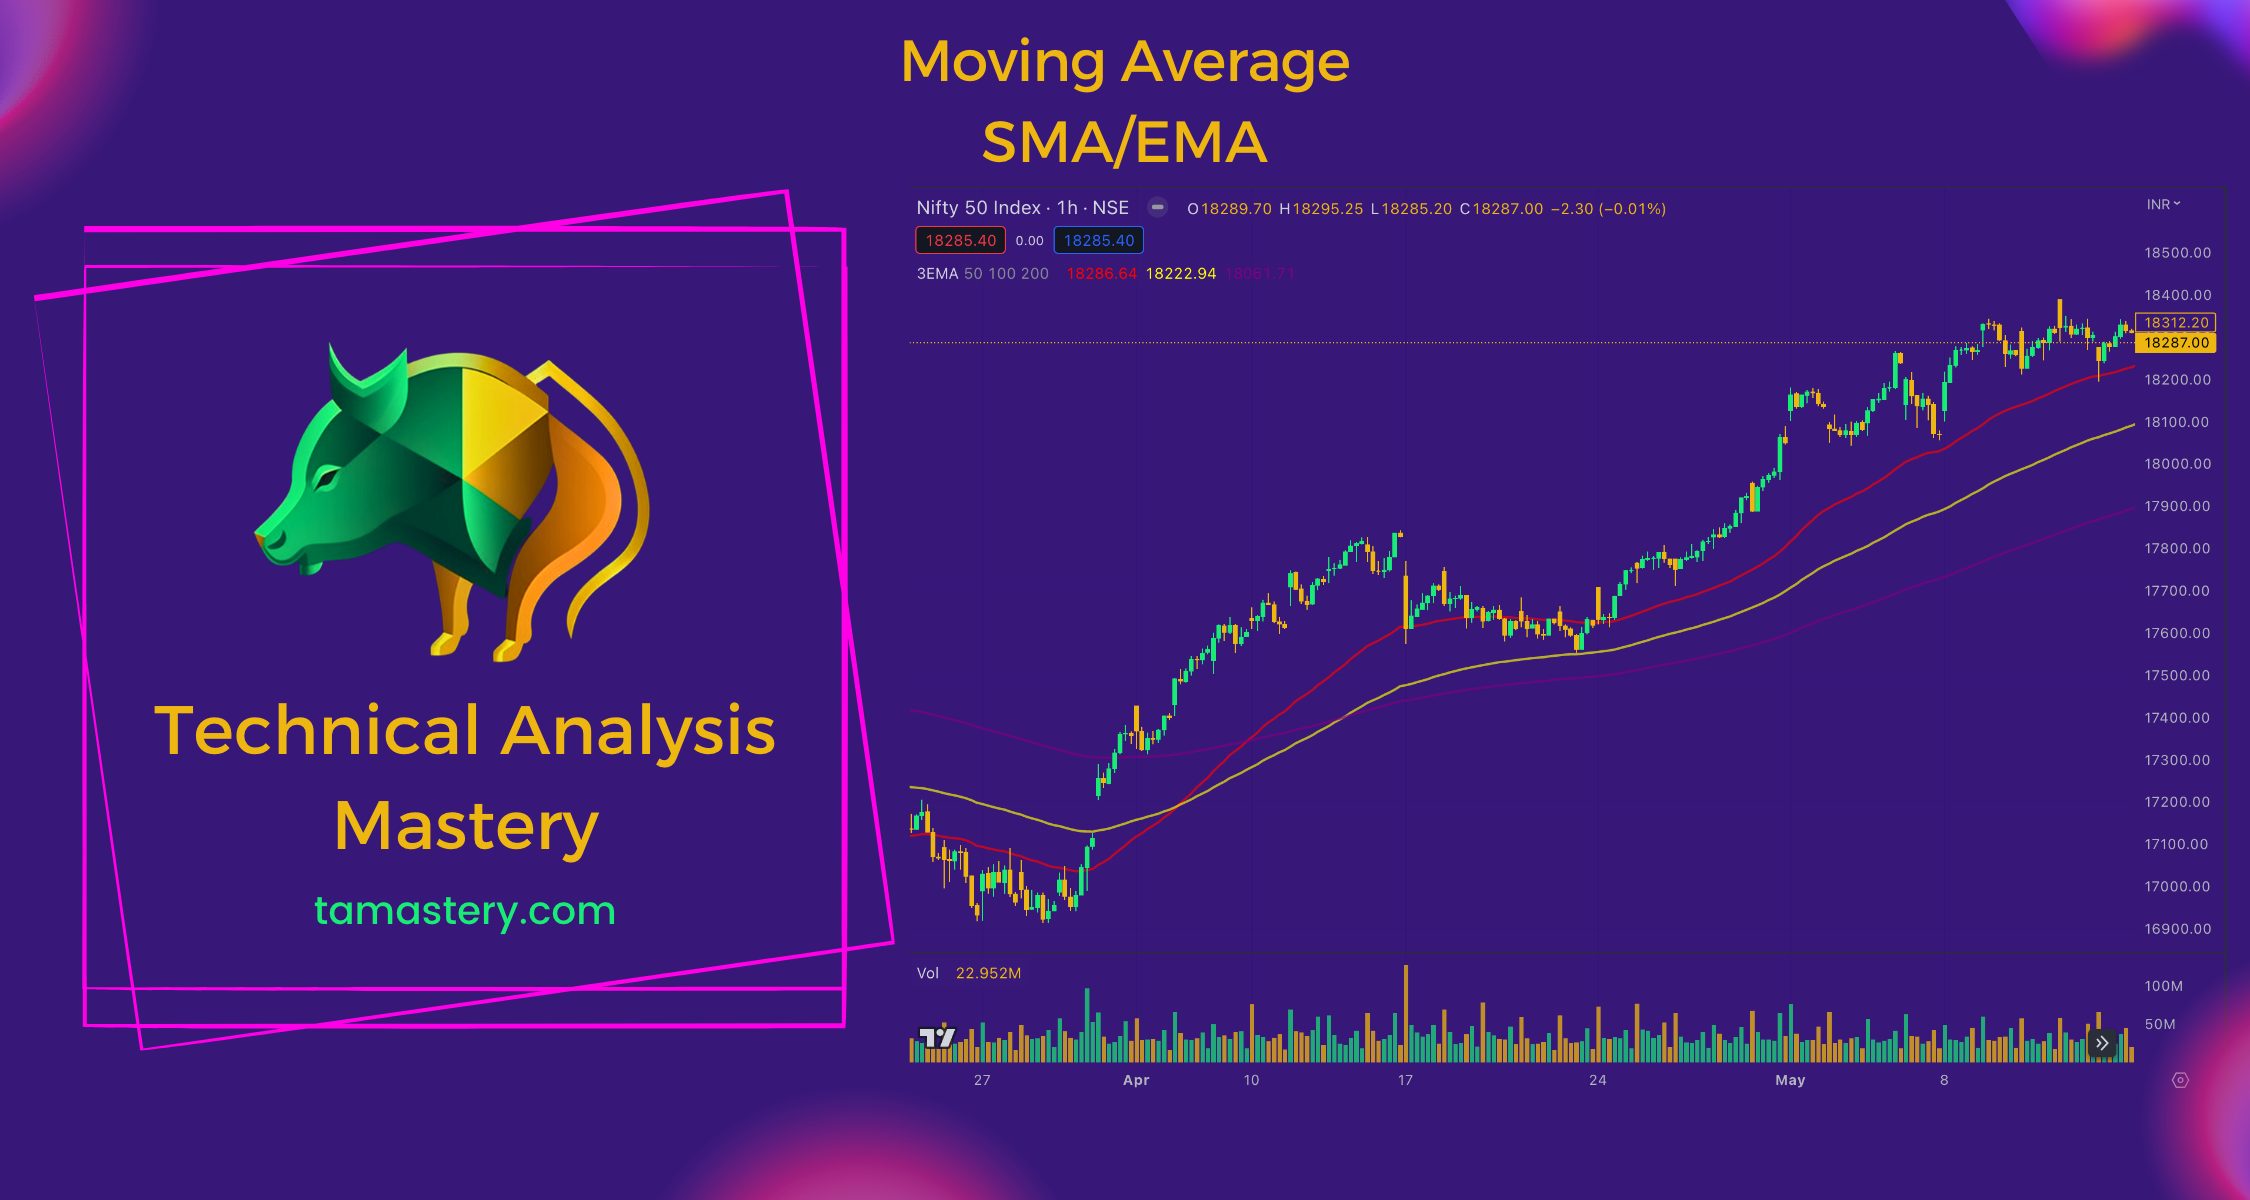
Understanding the Moving Average: A Key Tool in Stock Trading
Explore the world of Moving Averages in stock trading and understand how they can help you analyze trends. Learn about Simple Moving Average (SMA) and Exponential Moving Average (EMA), and discover effective ways to incorporate them into your trading strategy.

Introduction
Imagine the stock market as a big, exciting game, full of twists and turns. In this game, we use special tools called technical indicators to help us make decisions, much like using a compass or map in a treasure hunt. Today, let's talk about one of these cool tools, the Moving Average. It's like a trail in the woods that helps us follow where a stock price has been.
What is a Moving Average (MA)?
The Moving Average (MA) is pretty simple. Think about how you would calculate the average grade in your class or the average score in a series of baseball games. It's just like that! But instead of grades or scores, we're averaging the prices of a stock. Averaging helps us get a clearer picture and reduces the 'noise' of daily ups and downs.
How the Moving Average Works
So how do we find this average? We take the stock's price over a certain period — say 10 days, 20 days, or even 50 days — and average them out. It's like how you might take the average temperature over a week to understand if it's generally hot or cold.
Why Moving Averages are Helpful in Trading
The Moving Average is like a guide, helping us see the overall trend in a stock's price. Just like finding the pattern in a series of numbers, we can tell if the price is generally going up (like going uphill), or generally going down (like going downhill).
Types of Moving Averages
There are a few types of Moving Averages, like the Simple Moving Average (SMA) and the Exponential Moving Average (EMA). For now, let's focus on the SMA, which is just a straightforward average of the prices.
How to Use Moving Average in Trading
When it comes to making decisions, if the price is above the Moving Average line, it might be a good time to buy. But if it's below, it might be a good time to sell. It's a bit like deciding whether to bring an umbrella based on if the average rainfall is going up or down.
Conclusion
Just like any tool, the Moving Average isn't a magic crystal ball. But it helps us understand trends in the stock market, just like a trail helps us see where we've been. Remember to keep exploring other tools, too, because no one tool can perfectly predict the market.
Glossary
- Average: Adding up a bunch of numbers, then dividing by how many numbers there are.
- Trend: The general direction in which something is developing or changing.
- Moving Average (MA): A tool used in trading to smooth out price data by creating a constantly updated average price.
- Simple Moving Average (SMA): The simplest form of a moving average, calculated by adding the last 'X' period's closing prices and then dividing that number by X.
- Exponential Moving Average (EMA): A type of moving average that gives more weight to the most recent prices, making it more responsive to new information.
