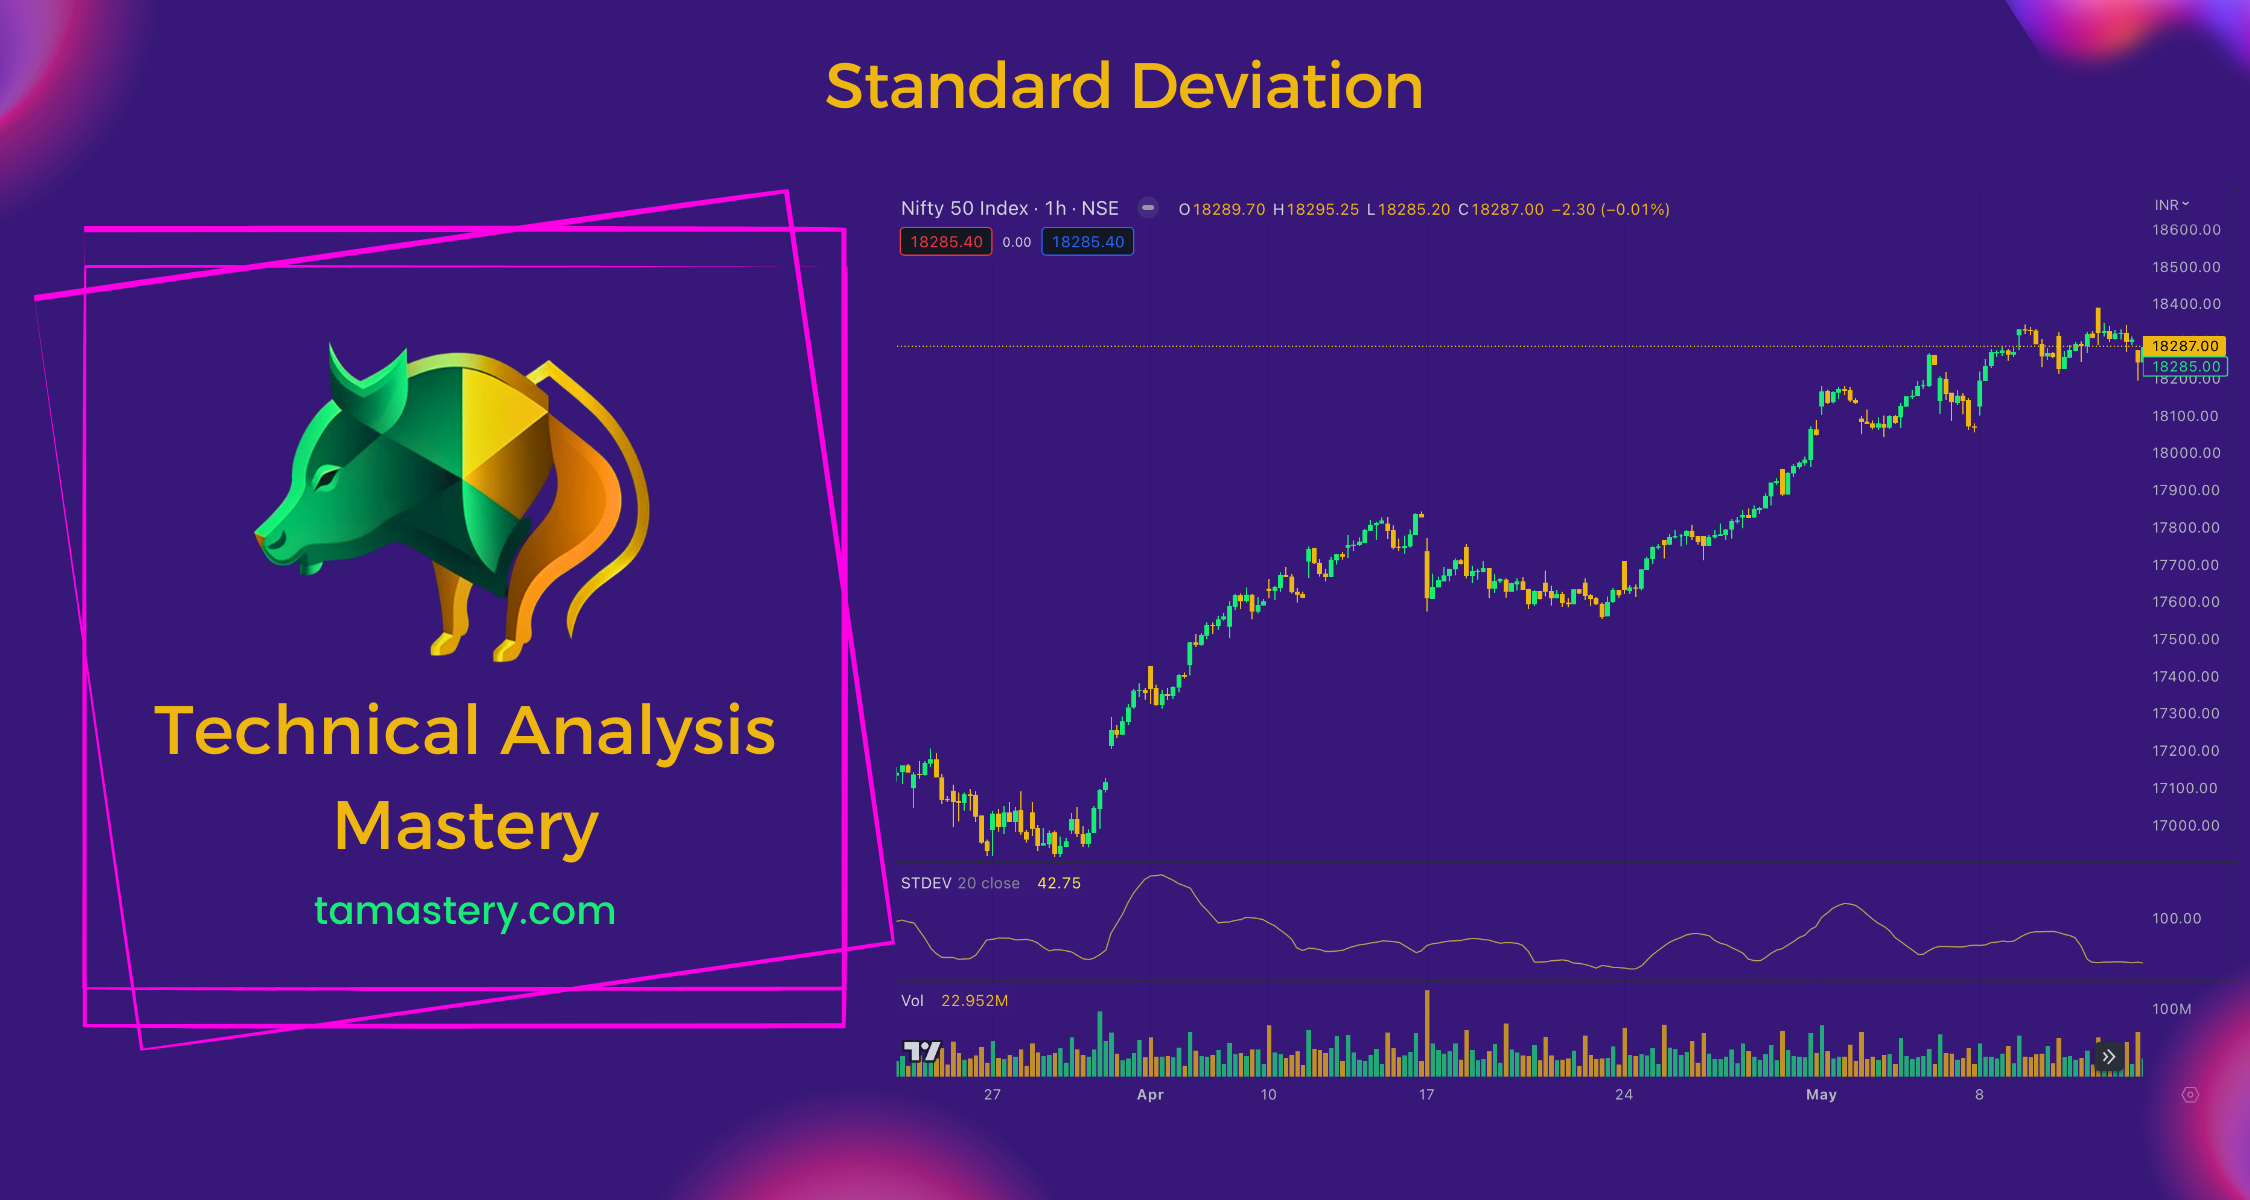
Standard Deviation: The Bounce-o-meter of Stock Trading
Discover Standard Deviation in stock trading, the 'bounce-o-meter' gauging price jumps. This tool aids traders to predict volatility and make informed decisions.

Introduction
Let's think of the stock market as a playground. It's an exciting place filled with movement, but it can also be unpredictable. That's why we have certain tools, called technical indicators, that help us understand these movements. One such tool is the Standard Deviation, which we can think of as the 'bounce-o-meter' of trading, showing us how much a stock's price jumps around.
What is Standard Deviation?
Standard Deviation is a way of seeing how much a stock's price swings compared to its average price. Think about it as a 'bounce-o-meter' for a ball. It shows us how bouncy the ball is, or in our case, how much a stock's price can vary.
How Standard Deviation Works
To calculate Standard Deviation, we look at how much each day's price differs from the average price over a certain period. Imagine you're watching a ball bounce. Each bounce might be a little different—some higher, some lower. Standard Deviation is like measuring these differences compared to the average bounce height.
Why is Standard Deviation Helpful in Trading?
Standard Deviation helps traders understand if a stock's price is likely to make big jumps or stay relatively stable. If we know how bouncy a ball is, we can anticipate if it will likely make high bounces or stay closer to the ground. The same idea applies to stock prices.
How to Use Standard Deviation in Trading
If the Standard Deviation is high, it means the stock's price is very bouncy and could change a lot. Just like a super bouncy ball, this could mean more risk because the price can jump high or drop low quickly, but it also holds potential for more profit if the price jumps in the right direction.
If the Standard Deviation is low, it means the stock's price isn't that bouncy and is likely to stay more stable. Like a ball that doesn't bounce very high, this might be safer because the price isn't likely to change drastically, but it might also offer less potential for big profits.
Conclusion
Standard Deviation works like a 'bounce-o-meter' in trading, helping traders to understand how much a stock's price might jump around. It's a powerful tool to anticipate price movements, but it's important to remember that it's just one of many tools, and none of them can predict the future perfectly. So, continue learning about other technical indicators, to gather as many hints as possible about the movements on your trading playground.
Glossary
- Standard Deviation: A measure of how much a stock's price jumps around compared to its average price.
- Technical Indicator: A tool that helps traders understand the movement of stock prices.
- Average Price: The sum of all prices over a certain period divided by the number of prices.
- Risk: The chance of losing money in trading.
