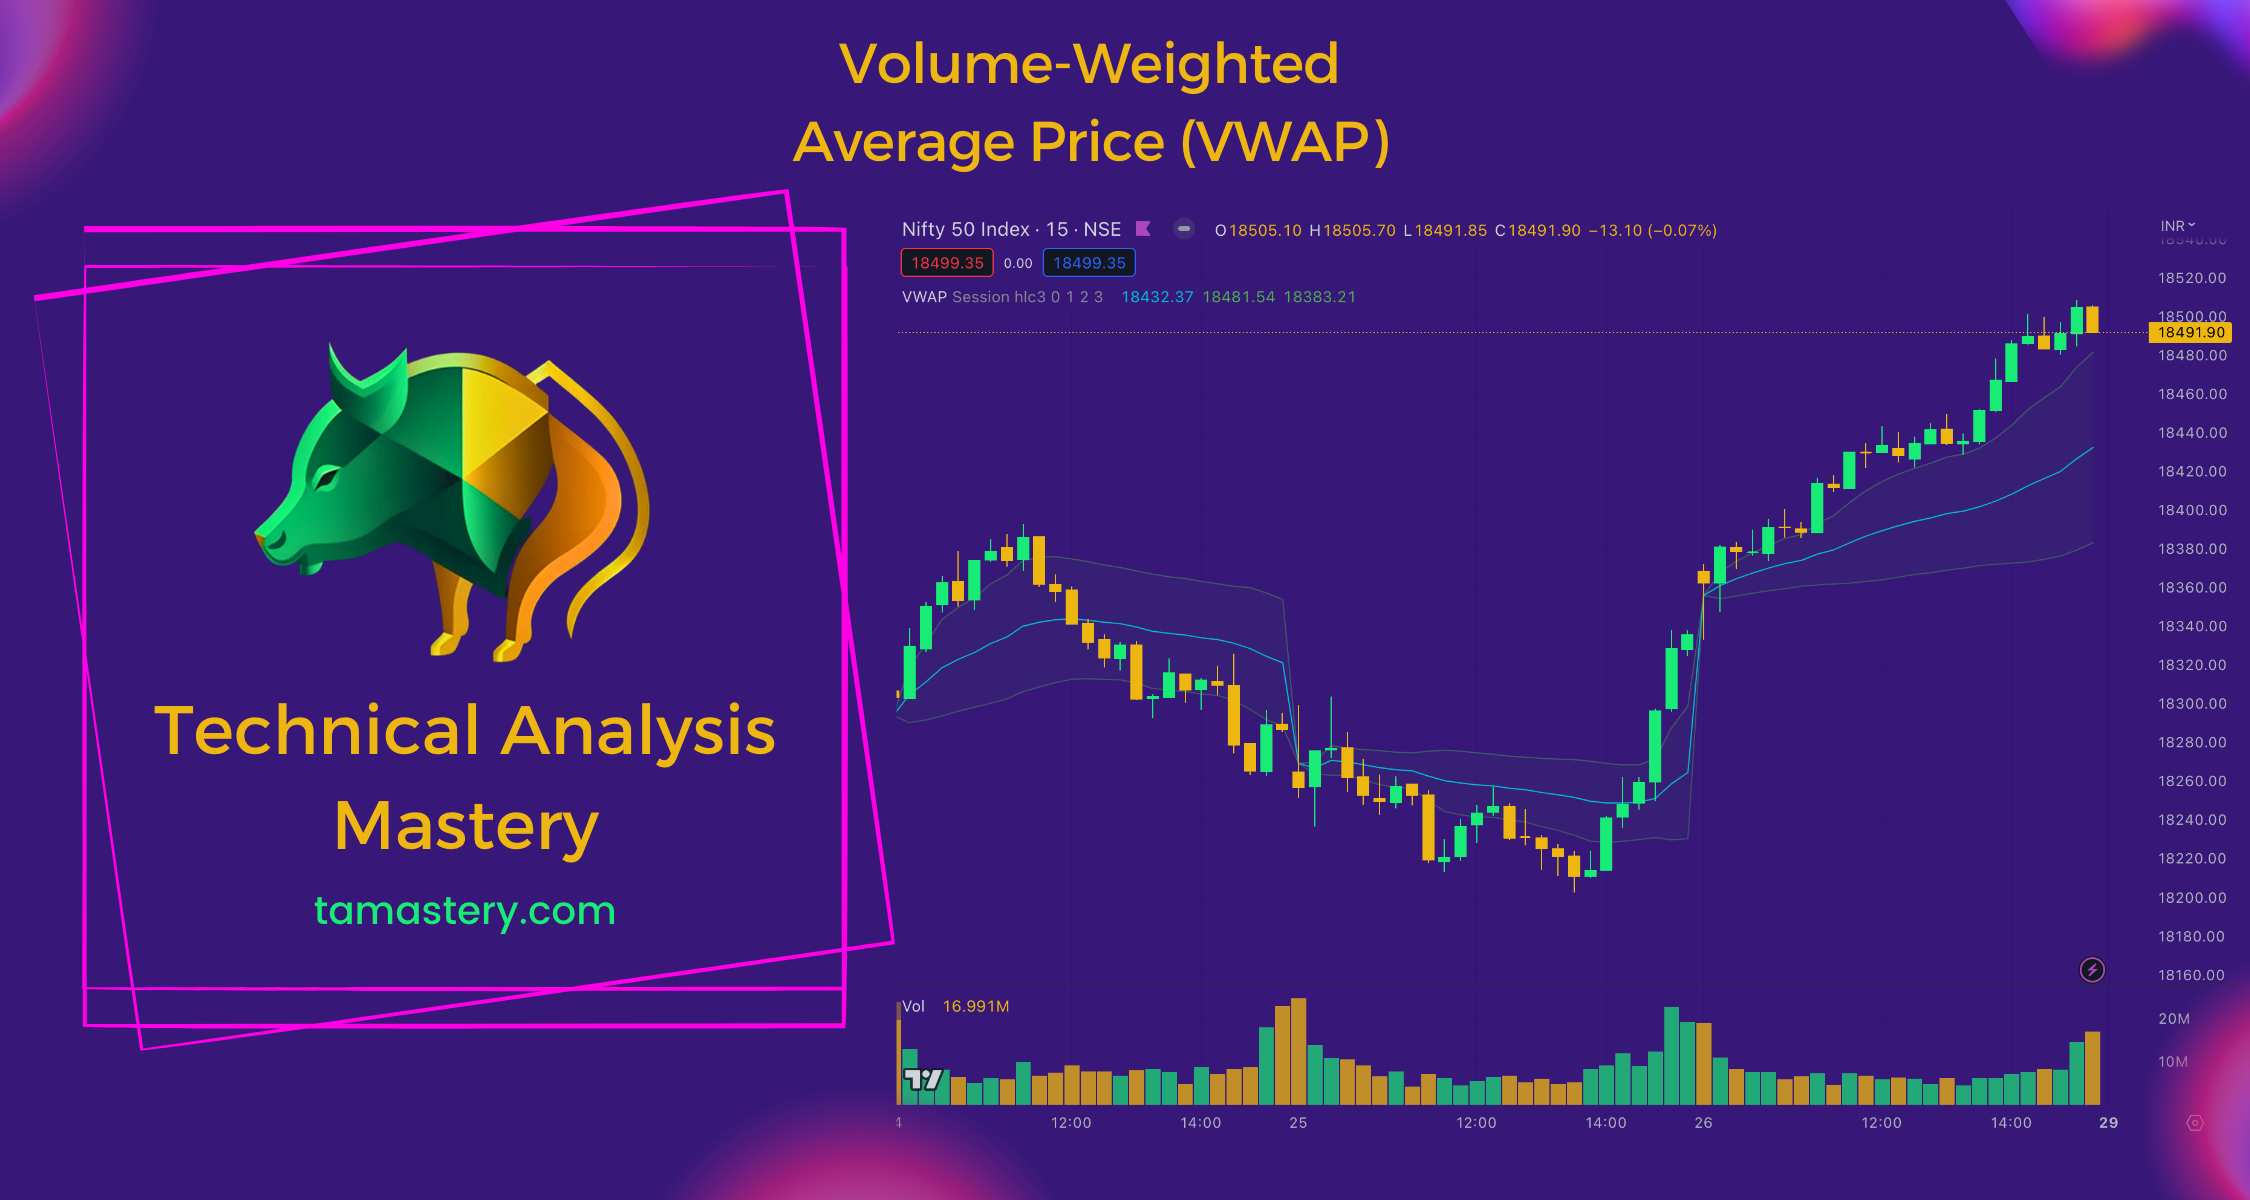
Volume-weighted Average Price (VWAP): The Stock Market's Own See-Saw Balance Point
Discover the secrets of the Volume-weighted Average Price (VWAP), a crucial balance point in stock trading. Learn how VWAP, like a see-saw, helps evaluate whether a stock's price is high or low relative to its trading volume, thereby aiding traders in making informed decisions.

Introduction
Just like a city's buzzing marketplace, the stock market is a bustling arena of buyers and sellers. Technical indicators serve as helpful tools in this busy market, like a compass guiding traders on their journeys. Today, we'll explore the Volume-weighted Average Price (VWAP), the stock market's see-saw balance point. VWAP can provide useful insights on whether a stock's price is high or low compared to its trading volume.
What is VWAP?
Picture a see-saw in a playground. On one side, you have the stock price, and on the other side, you have trading volume. The VWAP is like the balance point of this see-saw. It's a line on a stock chart showing an average price that is influenced, or 'weighted,' by the number of stocks (volume) being traded.
How VWAP Works
The math behind VWAP might seem intimidating, but it's quite straightforward. We calculate it by adding up the dollars traded for every transaction (price times shares traded) and then dividing by the total shares traded. So, if a lot of shares are traded at a certain price, that price gets more weight in the VWAP calculation. It's just like how a see-saw moves based on the weight of people sitting on each end.
Why is VWAP Helpful in Trading?
VWAP offers a perspective on whether a stock's price is a good deal compared to how much it is being traded. Imagine being on a see-saw; you can tell if one side is heavier (meaning the price is high compared to volume) or lighter (the price is low compared to volume). This information can help traders understand if a stock is being traded at a fair price.
How to Use VWAP in Trading
Picture it like a tracker that keeps a record of the average price people have paid for a stock throughout the day. It's sort of like when you and your friends all buy the same snack but at different prices, and then you figure out the average price you all paid.
Now, if you notice a stock's price sitting above this average (the VWAP line on a chart), it's like the snack is now more expensive than what you and your friends paid. That might mean it's a good time to sell if you have some. If the stock's price is below the average, it's like the snack is cheaper now, and it might be a good time to buy.
But remember, using VWAP is like using a single ingredient in a recipe; it's just one part of the whole mix. It's not a magic sign that tells you to buy or sell straight away. It's more like a helper that can tell you if you're getting a good deal compared to other traders during the day.
Also, don't forget that VWAP only works for a single day at a time. It's like your daily step counter; it resets every day. So, it's typically used by traders who buy and sell on the same day (day traders).
For the best trading strategy, it's smart to use VWAP with other tools. It's like using a recipe; a good dish requires more than one ingredient. Pairing VWAP with another tool like the Relative Strength Index (RSI) or Moving Average Convergence Divergence (MACD) can help you make better decisions.
Finally, keep in mind that VWAP isn't always perfect. It assumes that the stock's price is just as likely to go up as it is to go down, which isn't always true. Things like news or other events can make a big difference to a stock's price.
So, while VWAP can be a handy helper, it shouldn't be the only thing you rely on when deciding to buy or sell. Think of it as a member of your trading toolkit, to be used alongside other useful tools, to help you make the best decisions you can.
Conclusion
Just as the balance point on a see-saw helps us understand the weight distribution, VWAP assists traders in making informed decisions on when to buy or sell a stock based on volume-weighted price data. While VWAP and other technical indicators are invaluable aids, they can't predict the stock market with absolute certainty. So, stay curious, keep learning about other tools, and always take a balanced approach to your trading journey.
Glossary
Volume-weighted Average Price (VWAP): An indicator used by traders that gives the average price a security has traded at throughout the day, based on both volume and price.
Trading Volume: The number of shares or contracts traded in a security or an entire market during a given period.
Overpriced: A stock is considered overpriced when its current price isn't justified by its earnings outlook or Price/Earnings (P/E) ratio.
Underpriced: In contrast, a stock is considered underpriced when it's selling for a price presumed to be below its intrinsic value.
